COVID-19 Dashboard
The purpose of this dashboard is to show COVID-19 data visualizations that were created using SQL queries in Tableau.
COVID-19 Dashboard
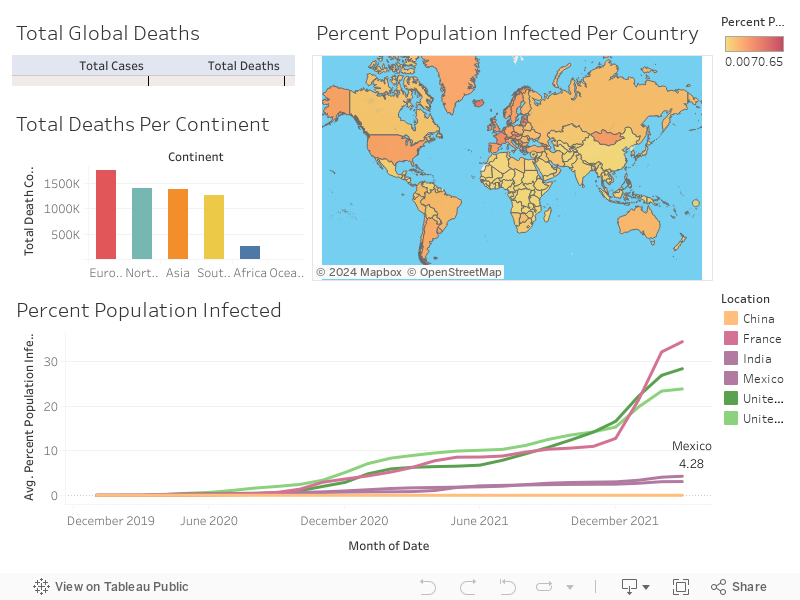
The table top-left shows the death percentage which means how often those who are infected die from COVID-19.
	Death Percentage Forumula
	(Cases/Deaths)*100

	SQL Query Used
	Select Location, date, total_cases,total_deaths, (total_deaths/total_cases)*100 as DeathPercentage
	From PortfolioProject_Covid..CovidDeaths
	Where location like '%states%'
	order by 1,2